-
 Andrew
405On another thread I decided to pull my head in. But I was reminded about the need to question.
Andrew
405On another thread I decided to pull my head in. But I was reminded about the need to question.
It seems to me that in all these threads / posts on Covid no one has asked the single most important question - which must surely be:
What is the is the likelihood that an employee may be harmed or suffers adverse health effects such as Covid 19 if exposed to a SARS-CoV-2.
So I have made an attempt to answer that question.
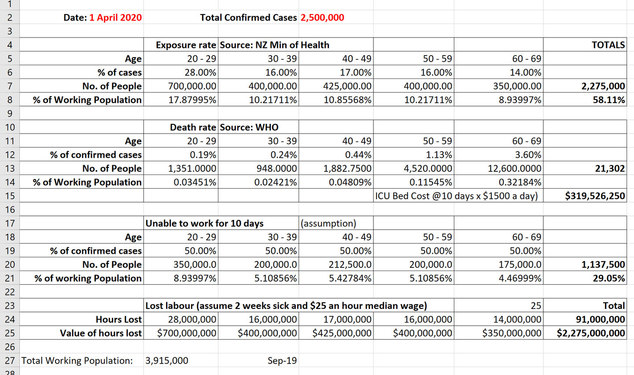
Currently NZ is in shutdown and experiencing approx. 50 infections per day or 0.001% of the total NZ population. Lets call that the exposure rate.
Now lets refine the exposure rate to our working population. Using current NZ Min of Health statistics:
20 – 29 Year olds account for 28% of cases or 14 per day
30 – 39 year olds account for 16% of cases or 8 per day
40 – 49 year olds account for 17% of case or 8 per day
50 – 59 Year old account for 16 % of cases or 8 per day
60 – 69 year old account for 14% of cases or 7 per day
Now lets look at the Age distribution of deaths – so we are looking at the very worse case scenario. WHO reckons
20 – 29 Year olds 0.193% of cases will die. So 0.027 of a person per day
30 – 39 year olds 0.237% will die. So 0.019 of a person per day
40 – 49 year olds 0.443% will die So 0.035 of a person per day
50 – 59 Year old 1.3% will die So 0.091 of a person per day.
60 – 69 year old 3.6% will die. So 0.091 of a person per day.
If I add all that up we are looking at a 1/4 of a person in the working adult population a day will die.
But lets wind the data back a bit and just look at illness. I cant find any hard data on this. But lets say 50% of cases of people would be unable to attend work due to the severity of their symptoms. That gives us 22 people in the whole of NZ who would be away sick today. Lets assume that rolls for 10 days we are looking at a grand total of 220 sick people in our adult working population.
And given people are at work 8 hours a day and at home 8 hours a day we can probably attribute 110 sick people to the work environment.
Feel free to either use that number as you will or correct refine it for me.
But most importantly do a risk assessment when considering any Covid action -
 Craig Marriott
206The situation is fairly static right now given the lockdown, so this is reasonable for essential workers - and I gave similar advice to somebody yesterday when discussing ppe requirements for current work.
Craig Marriott
206The situation is fairly static right now given the lockdown, so this is reasonable for essential workers - and I gave similar advice to somebody yesterday when discussing ppe requirements for current work.
Where an epidemic is different to other risks is that the risk is continually increasing at an exponential rate (when not under lockdown). Five weeks ago Italy had 67 new cases in one day - three weeks later it was over 6000.
It also rapidly expands to impact on areas outside of your immediate control - availability of staff, equipment, health care, emergency services, etc and so becomes very complex very quickly. A standard risk assessment becomes mostly obsolete in a complex environment because cause and effect get messed up. Great article about this topic posted a couple of days ago here https://www.linkedin.com/pulse/how-coronavirus-may-stress-test-which-finally-unmasks-warren-black/?trackingId=FrT%2BA6fVcBGDaK7cku70zA%3D%3D -
 Aaron Marshall
118
Aaron Marshall
118
Yes, with an exponential growth, you are in a feedback loop. Hopefully we don't get there...A standard risk assessment becomes mostly obsolete in a complex environment because cause and effect get messed up. -
Andrew
405After reading the above article thought I'd look at the numbers again.
So first off a bit of a back of the envelope model on the basis we do absolutely nothing. Assume 2.5m infections and I get 21,000 deaths which is close to Otago Universities model. Chuck in sick leave for those that get sick. If we do absolutely nothing we end up with a worse case scenario over say a 9 month period.
By doing nothing we end up with a relatively simple system. 21,000 deaths, 1.1m sick in bed. Total costs around $2.6b
-
Aaron Marshall
118
And probably for a good reason. There are two ways to reduce the confirmed case numbers:
1. reduce the actual number of cases, or
2. limit testing.
Its why you should be wary of using the number of safety reports as a safety performance indicator.
P.S. I see that there are another 89 cases, which goes against what the trend appeared in your graph -
Andrew
405Aarfon
Its a given we can only use the numbers that are available to us. What I am finding is
1) the actual numbers of cases appear to change. I put this down to Min of Health cleansing data after it is first published.
2) if data sources are limited then this will always limit the data results
Since I am one that remains wary of the data sources ( eg Stuff - I steer clear of that source) I am relying on a Min of Health data set. And this is a data set of confirmed cases. Not "probables" - I don't find that type of data very helpful.
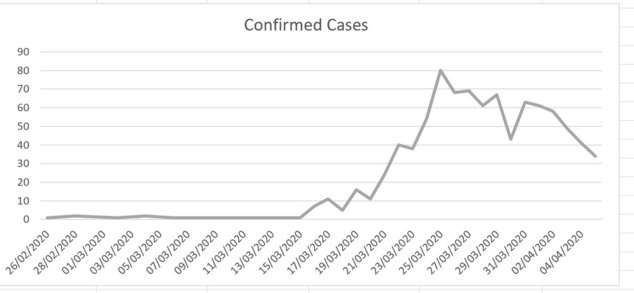
As at this afternoon this is what therconfimed case numbers looks like. You'll notice we have never hit 89 cases in a day. The biggest day of cases is 23 March with 80.
We should always be prepared to take data reports at face value and interrogate the numbers.
-
Aaron Marshall
118Fair enough, I think my number included probables.
But, if we can keep this trajectory going, even with increased testing, I'll be happy. -
Andrew
405
Aaron. I have a great deal of difficulty with "probables" I find that people tend to treat Probable like a rubber band and stretch things out to as far as the "catastrophic" end of the continuum as they can.
For some reason that I havent been able to fathom it strikes me that we like to catastrophise things. We dwell on the extreme and we do this in our risk assessments. And so it is with this topic - I just can't work out why "probables" are being reported - they are grossly distorting the public's view on risk.
I havent tracked probables but what I find fascinating is that the "probables" don't turn into "confirmed". So its a totally misleading and unhelpful statistic.
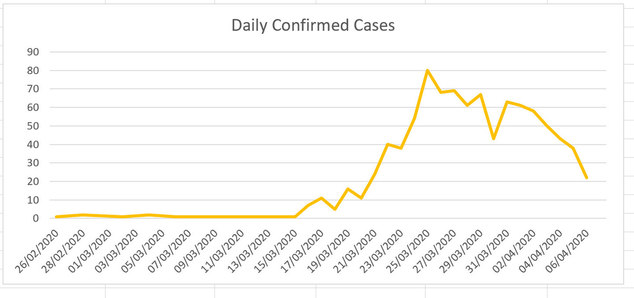
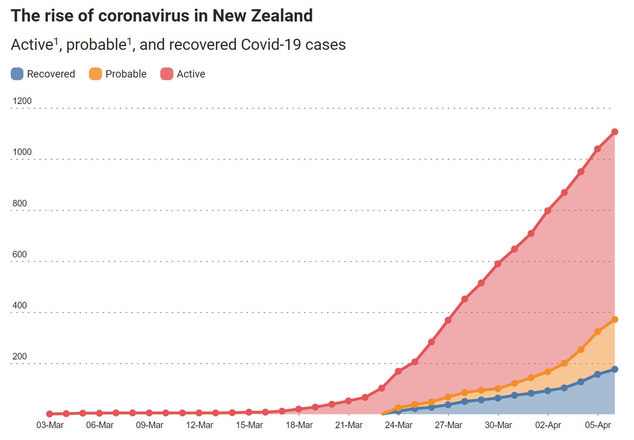
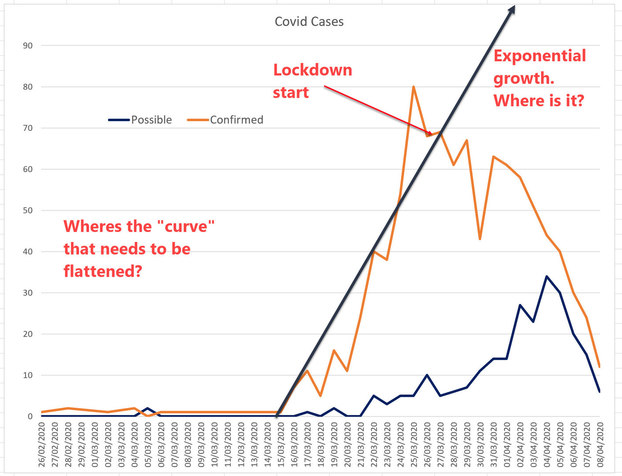
The cynic in me thinks that reporting is deliberately designed to instil fear and thus compliance. Look at these two charts. One is the media reporting Covid. The second is my graph of daily confirmed cases both as at today.
How do we think of "risk" when we have two very different pictures that use essentially the same information
-
Aaron Marshall
118
'Probables' include those who live with someone confirmed as having Covid19, and then go on to show symptoms. https://www.msn.com/en-nz/news/national/what-are-probable-cases-and-why-are-they-rising/ar-BB12emuK?ocid=spartanntp
Given the number of false negatives that are coming from testing, and the definition of exactly what a probable case is, I think it is dishonest to exclude them; after all, if you go to the doctor, and they tell you its the flu, you don't expect a lab test to confirm it. We haven't hit flu season yet, and this is the only respiratory virus going around at the moment, so what else is it likely to be? -
Andrew
405
Which only exacerbates the problem. By having "live with someone" the numbers are essentially doubling. The weirdness of the number is brought into stark reality when we consider to get a test you have to show symptoms - so therefore ought to be considered a "probable"
If I put my Tin Foil hat on, I'd suggest the only reason for the "probables" is to bolster the number sto support the narrative.
Lets look at the factual situation today.
Remember the original risk assessments. We were told by the experts and modlers this virus spreads at an exponential rate ( 1 person to three, those three to another three each and so on and so one.) We were told it is highly contagious and our hospitals won't cope. We need to "Flatten the curve"
Two weeks into lock down, with all the additional testing we should be at peak cases. We have had two weeks for those infected on day -1 to do all their spreading of germs and for those affected to display
and get tested and confirmed. The numbers ought to show we are at the top of the mountain and form here on the "curve" should start to happen.
But it simply hasn't happened. But by using "probables" we can give the illusion that we have a bigger problem than is actually the case.
To get to where we are today think it is more likely the original risk assessment models were wrong rather than good risk management.
-
Andrew
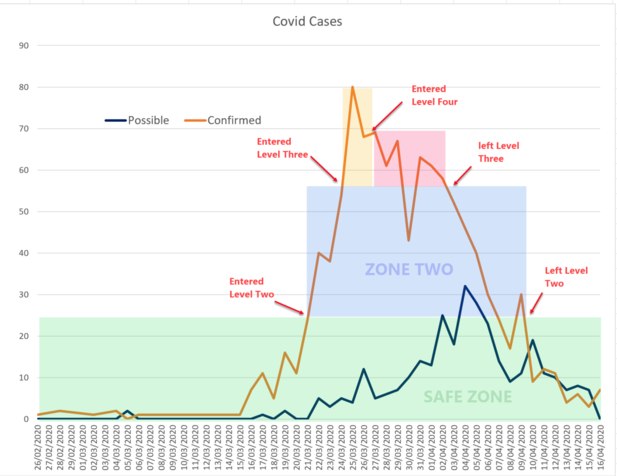
405We are now 21 days into Isolation so time to look at the Risk Assessment again. The risk being the SARS-CoV-2 Virus which we are essentially only able to identify through finding an infected person
It is quite clear we are now, subject to continued trend over the next week, at Safety Level One. And on this basis we, as employers and Health and Safety professionals, should be encouraging a proportional response and not investing one more second of time or one more dollar on this issue.
An outrageous claim you may say. But lets look at the data.
NZ employers, employees, government and society were quite happy to operate at Level One (“Disease Is Contained”) until 21 March when we hit 24 new daily confirmed cases. So it stands to reason that an environment of less than 24 new daily confirmed cases is the “Safe Zone”
If we look at the data we entered the Safe Zone on 7 April. If we allow 1 - 14 day (mostly around 5 days – Source = WHO) incubation period and remain under 24 new daily cases quite obviously this thing is contained if we remain in Zone One by 21 April at the latest.
Zone Two is a Zone where we all thought daily new confirmed cases between 24 and 54 was an area in which the “Disease is contained but risks of community transmission is growing”. We have been trending down since 25 March – so clearly the risk is reducing, not increasing. So no need to be at Level 2.
Now, you might say we are only in the Safe Zone because we are in Isolation. But again look at the data. We operated in Zone 2 and 3 and there was no exponential increase in daily cases. We were all roaming free when we hit 80 Daily cases. Apparently each of these people ought to have passed it on to three people so we should have seen 240 Daily cases and then increases until at least the 14 incubation period had passed. Didn’t happen.
Essentially no risk because we are in the previously established Safe Zone
These numbers are very important because they give us the basis of known risk rather than imagined risk. And as A PCBU we must manage these risks, as far as is reasonably practicable so these risks don't create health and safety to any person associated with our workplace.
And where this is critically important is that this doesn't mean preventing illness which can be a risk to the health of a person. Its also about related things that might also affect the health of a person. Time to think if our management is a greater risk than the virus risk itself. But more on that later
Here is the data – Source = Min Of Health.


Welcome to the Safeguard forum!
If you are interested in workplace health & safety in New Zealand, then this is the discussion forum for you.
More Discussions
- Free stuff
- Guidelines
- Terms of Service
- Useful Hints and Tips
- Sign In
- Created with PlushForums
- © 2025 Safeguard Forum